Year in Review
Year ended March 2026
Key Figures
- Net Sales
- ¥1,173.6billion
- 1.7%
- Operating Income
- ¥93.3billion
- 10.2%
- Operating Income Ratio
- 7.9%
- 0.6percentage points
- ROE
- 4.6%
- 2.2percentage points
- Capital Expenditures
- ¥103.7billion
- R&D Expenses
- ¥37.0billion
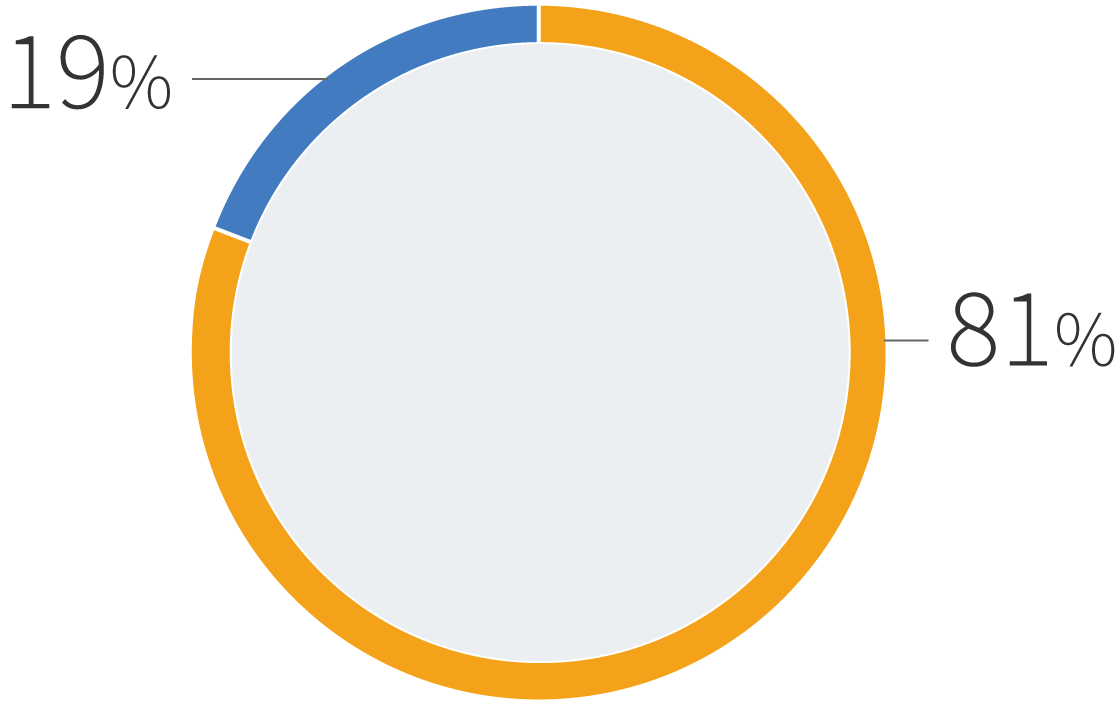
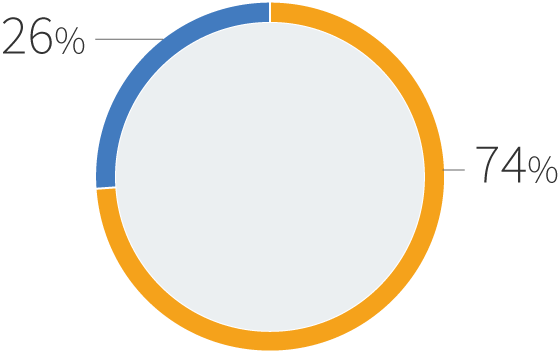
Breakdown by Segment
- Food
- Pharmaceuticals
Net Sales
Operating Income
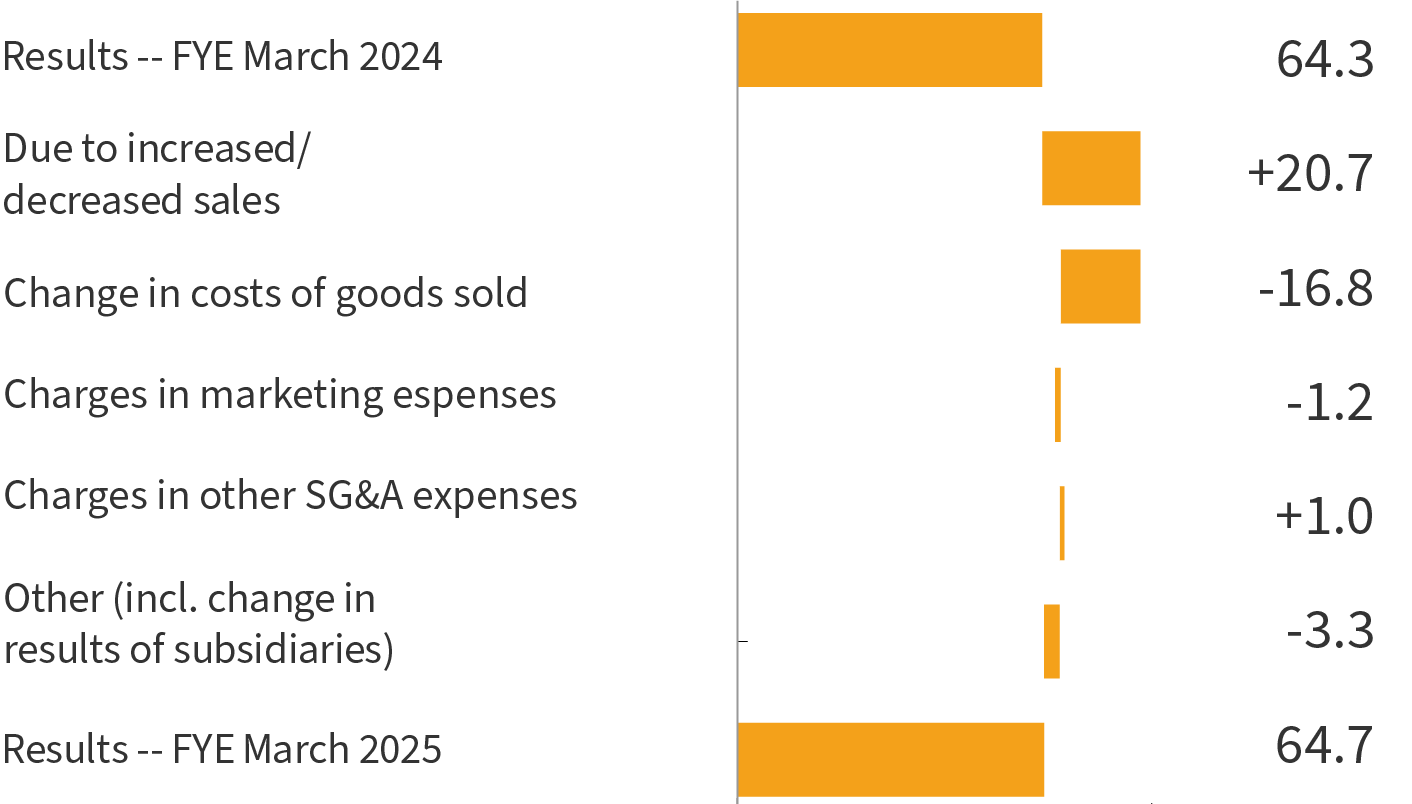
Business Performance Analysis
Food
- Net Sales
- ¥942.8billion
- 1.9%
- Operating Income
- ¥68.7billion
- 6.4%
- Income Analysis(Billions of yen)
-
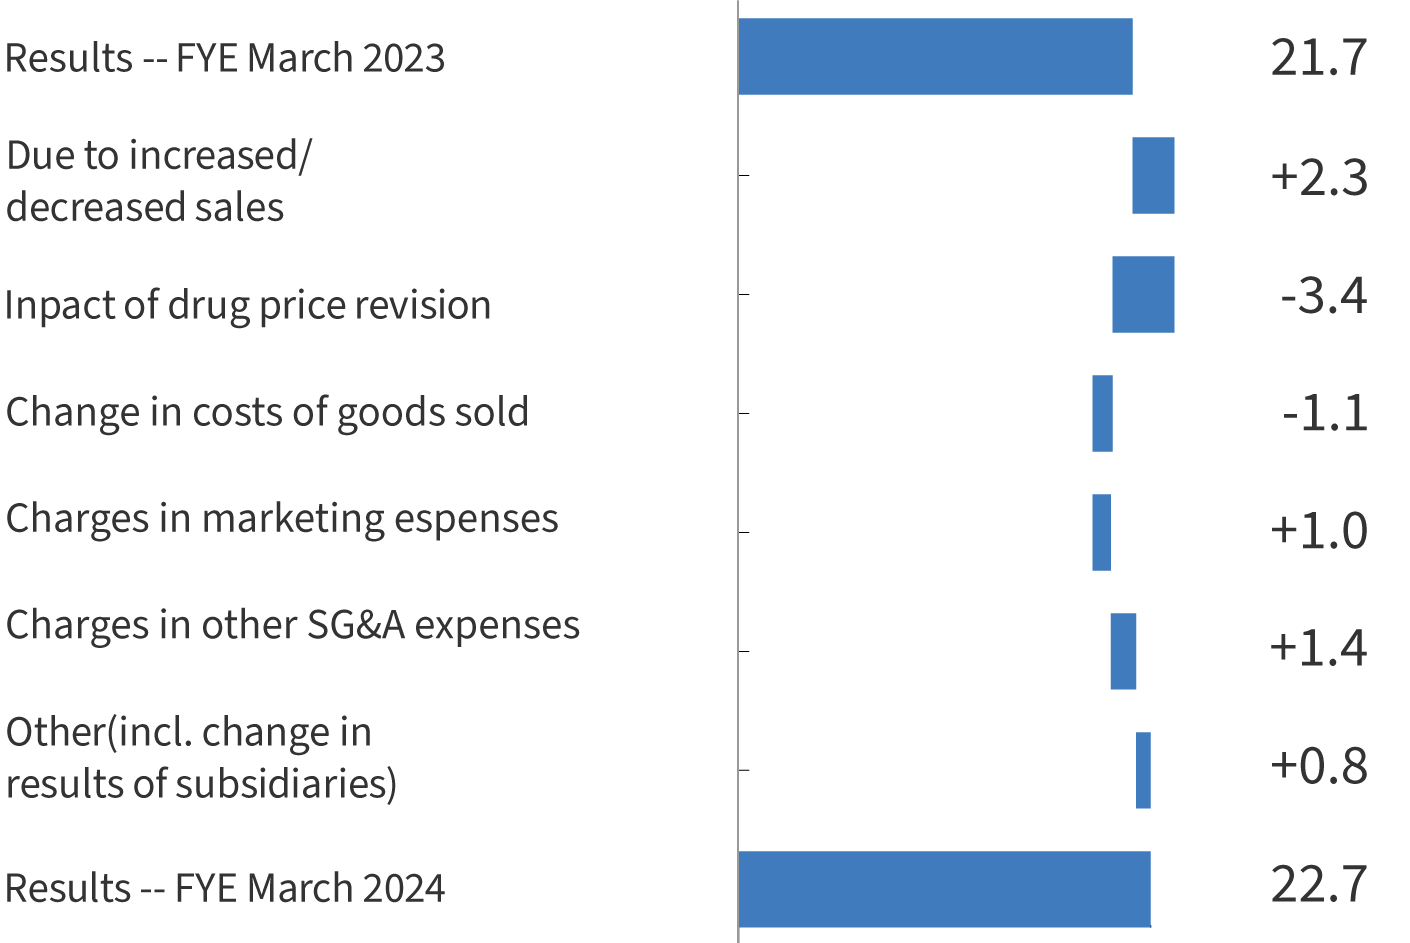
Pharmaceuticals
- Net Sales
- ¥232.2billion
- 1.1%
- Operating Income
- ¥30.4billion
- 23.1%
- Income Analysis(Billions of yen)
-
Capital Expenditures
- Food
- Pharmaceuticals
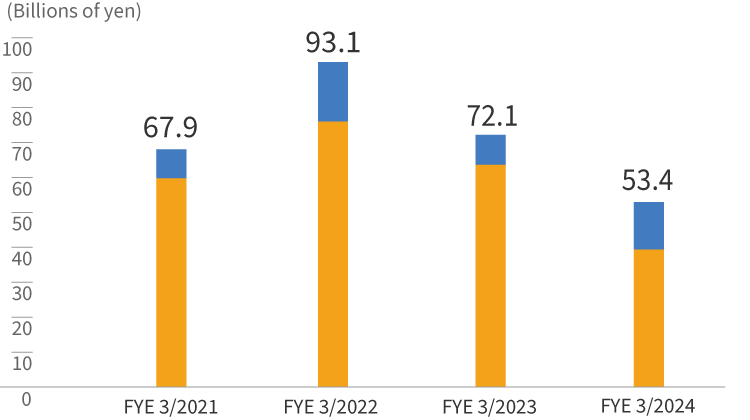
Food
¥52.9billion
Pharmaceuticals
¥49.9billion
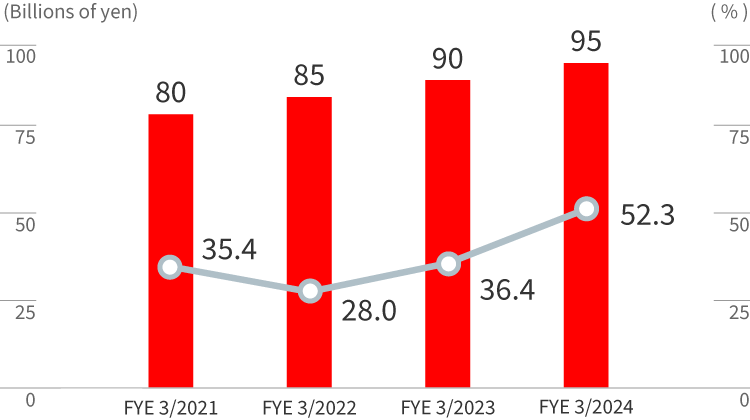
Cash Dividends per Share / Dividend Payout Ratio
- Cash Dividends per Share
 Dividend Payout Ratio